
Financial Statement Analysis: The Real Story Behind the Numbers

Financial statements talks about company’s story and performance.
But to understand it you need context, comparison, and clarity. That’s where financial statement analysis comes in.
In this article, I’ll Walk you through three core techniques — horizontal analysis, vertical analysis, and ratio analysis
Analyzing financial statements involves comparing various figures within the financial statements to each other to calculate ratios as well as comparing
a) Intracompany data (compare within the company)
b) Intercompany data (compare to competitors)
c) Industry averages (compare to an industry norm or benchmark)
1. Horizontal Analysis: Spotting Trends Over Time
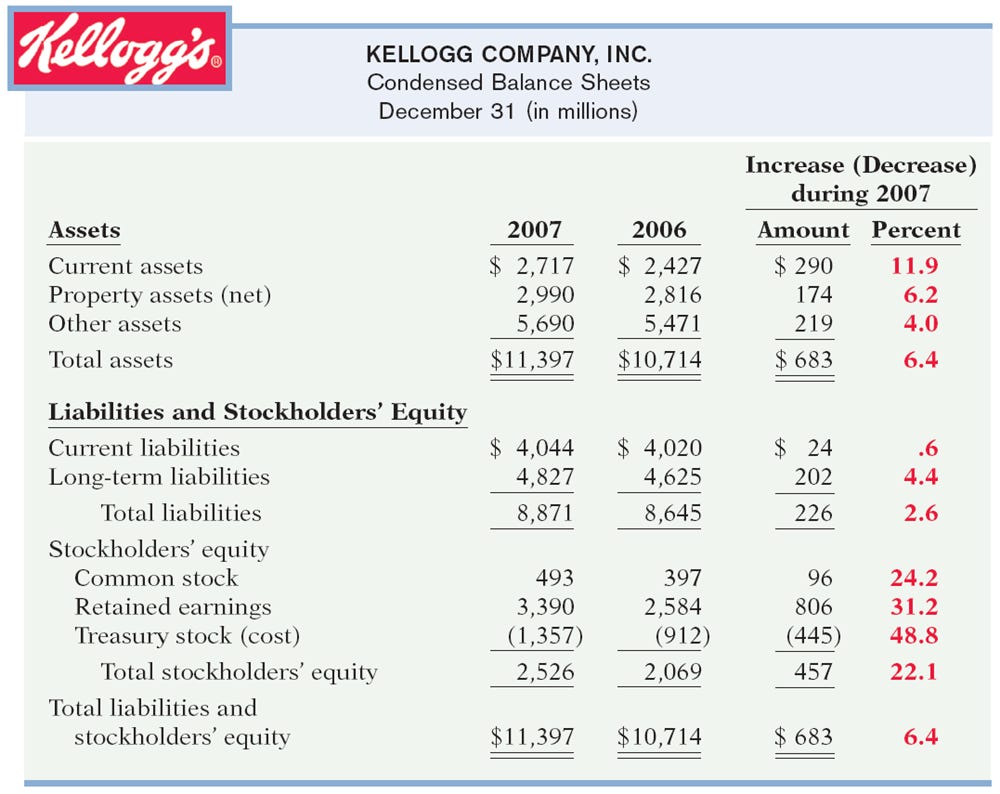
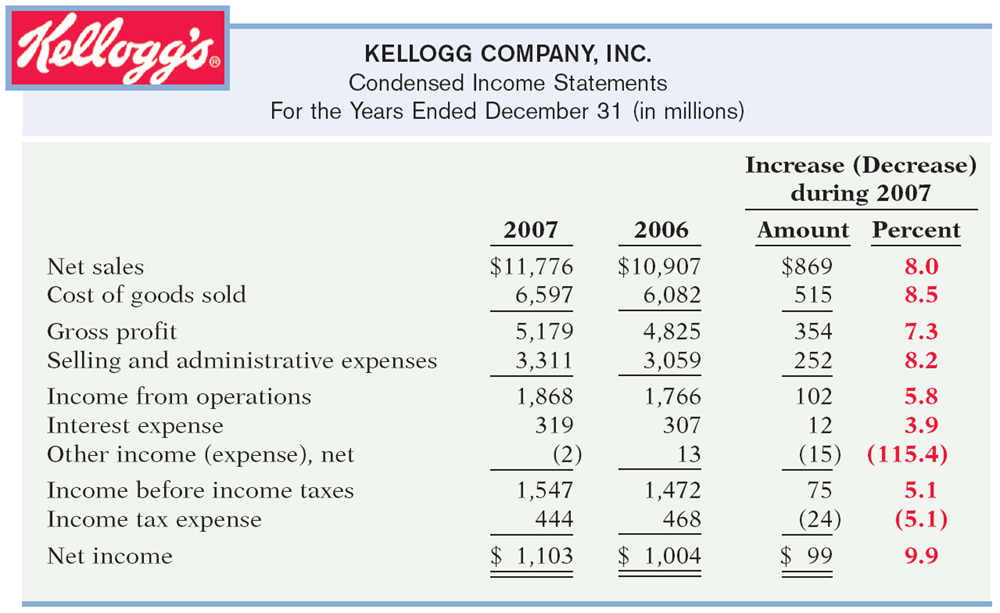
Horizontal analysis (Trend analysis) helps us compare financial performance over multiple periods. We look at the percentage increase or decrease in line items like revenue, expenses, and net income.
This can be applied to the balance sheet and income statement.
Formula:(Current Year – Previous Year) ÷ Previous Year × 100%
Kellogg Balance Sheet - Horizontal Analysis between year 2006 & 2007.
Kellogg Income Statement - Horizontal Analysis between year 2006 & 2007.
2. Vertical Analysis:
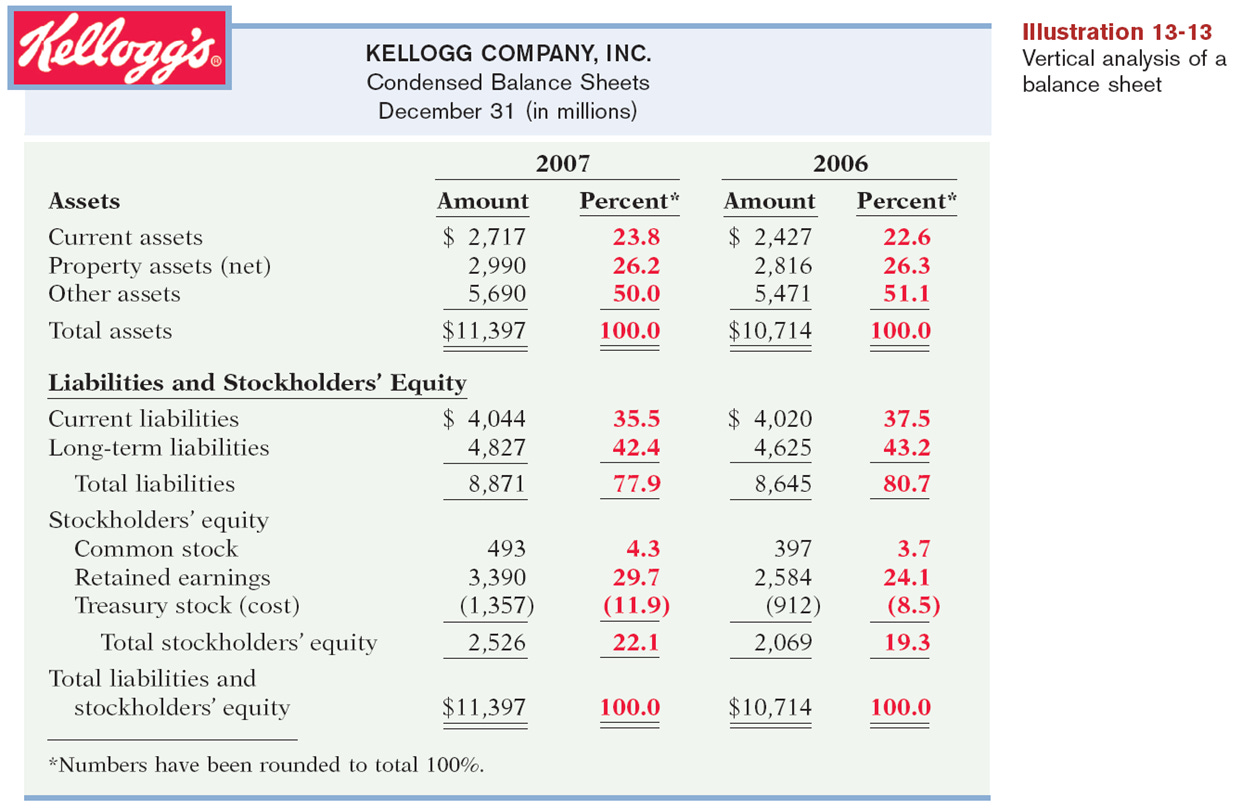
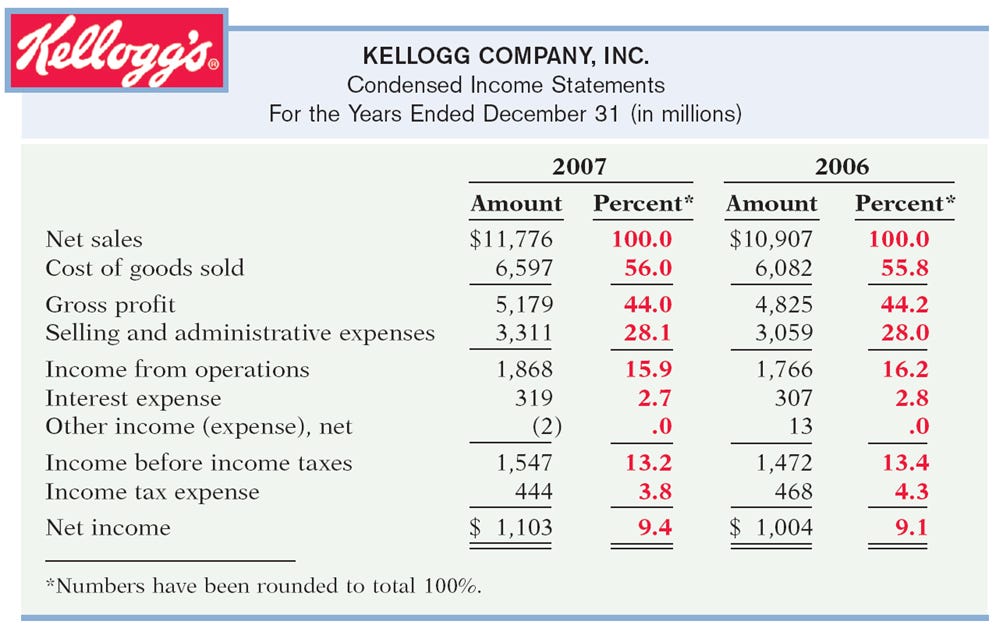
Vertical analysis, also called common-size analysis, is a technique that expresses each financial statement item as a percent of a base amount. This helps when comparing companies of different sizes or currencies.
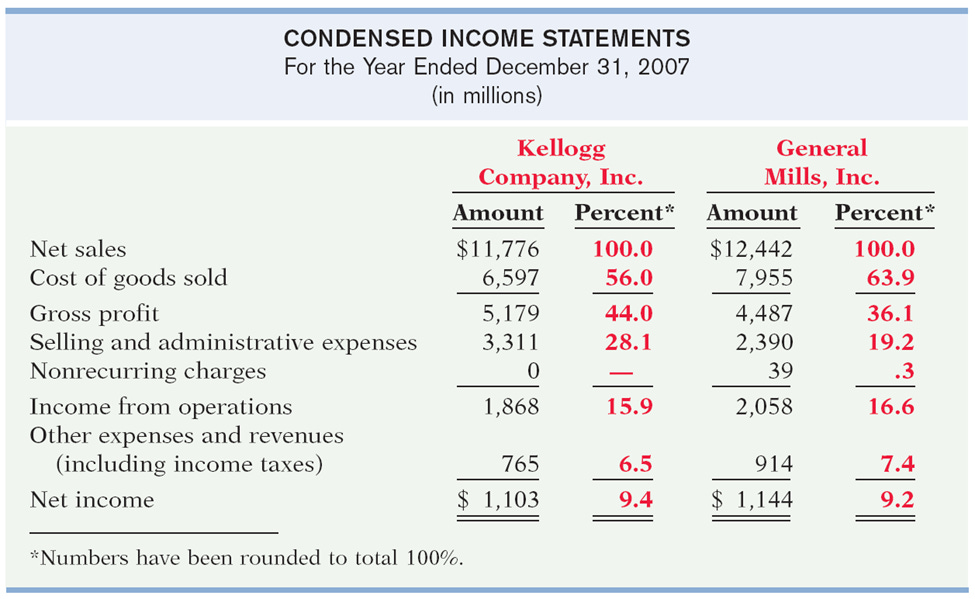
Vertical analysis is commonly applied to the balance sheet (using total assets as the base) and to the income statement (using total revenue or sales as the base)
Formula:
For income statements: Each line ÷ Total Revenue
For balance sheets: Each line ÷ Total Assets
Kelloggs Balance Sheet - Vertical Analysis
Kelloggs Income Statement Vertical analysis
Vertical Analysis of two companies:
3. Ratio Analysis:
Here’s where the real insights lie. By calculating key financial ratios, we can assess a company’s liquidity, solvency, and profitability.
🧾 Liquidity Ratios – Can the company pay short-term bills? It Measures the short-term ability of the company to pay its maturing obligations and to meet unexpected needs for cash.
Short-term creditors such as bankers and suppliers are particularly interested in assessing liquidity.
Current Ratio = Current Assets ÷ Current Liabilities
(Measures the short-term ability of a company to pay its maturing obligations and to meet unexpected needs for cash. This figure should always be greater than 1 and closer to 2. A figure of more than 4 could indicate that the company is not using its cash efficiently.)
Quick Ratio = (Current Assets – Inventory) ÷ Current Liabilities
(This ratio helps to solve the hidden problem of slow-moving inventory by removing it from the ratio.
Generally, this ratio should be at least 1)
Working Capital = Current Assets - Current Liabilities
A positive working capital figure suggests a greater likelihood that the company will be able to repay its current liabilities. A negative figure suggests that the company may not be able to pay its debts and may be forced into bankruptcy.
🏦 Solvency Ratios – Can company survive long-term?
Debt to Assets = Total Liabilities ÷ Total Assets
(It indicates the extent to which a company’s assets are financed with debt. Debt financing is more risky than equity financing because debt must be repaid at specific points in time, whether the company is performing well or not – so more debt equals more risk
A rough benchmark is 50% debt and 50% equity, but there are many exceptions)
💰 Profitability Ratios – Is the business making money?
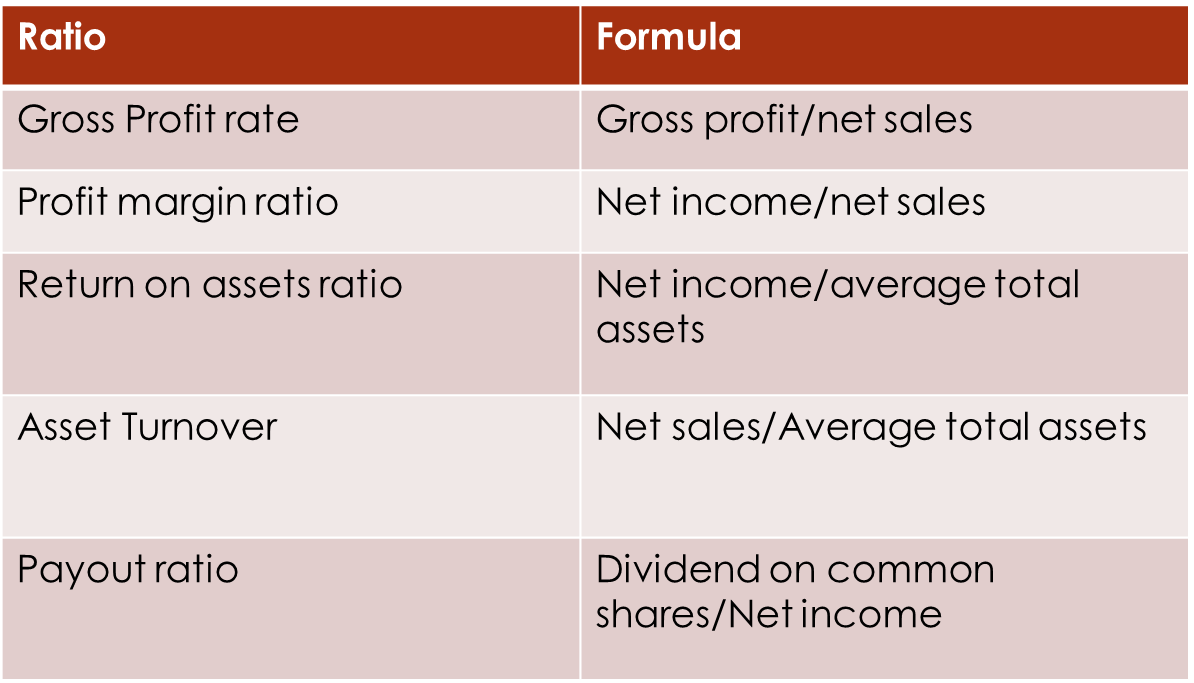
Gross Profit Rate: A company’s gross profit may be expressed as a percentage by dividing the amount of gross profit by net sales.
Decline in the gross profit rate might have several causes.
The company may have begun to sell products with a lower “markup.”
Increased competition may result in a lower selling price.
Company may be forced to pay higher prices to its suppliers without being able to pass these costs on to its customers.
Profit Margin Ratio - Measures the percentage of each dollar of sales that results in net income.
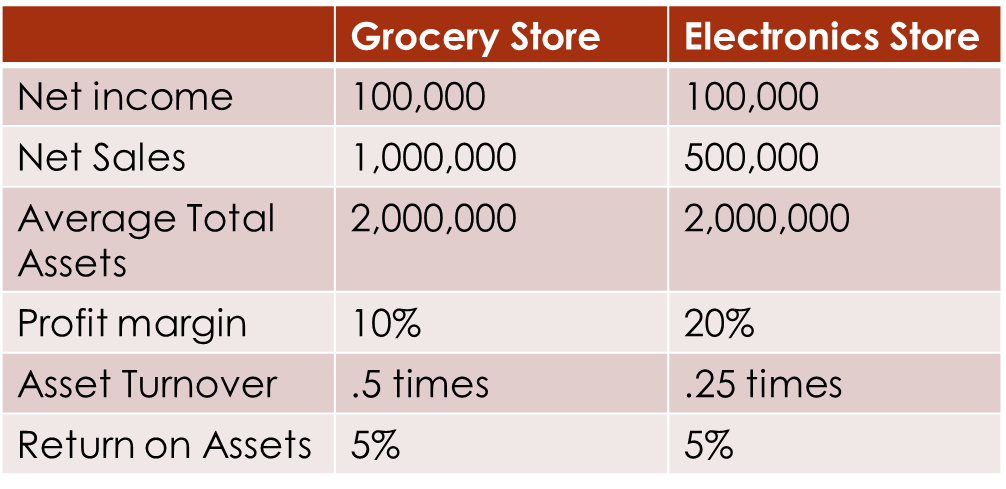
High-volume (high inventory turnover) businesses such as grocery stores and pharmacy chains generally have low profit margins.
How do the gross profit rate and profit margin ratio differ?
Gross profit rate - measures the margin by which selling price exceeds cost of goods sold.
Profit margin ratio - measures the extent by which selling price covers all expenses (including cost of goods sold).
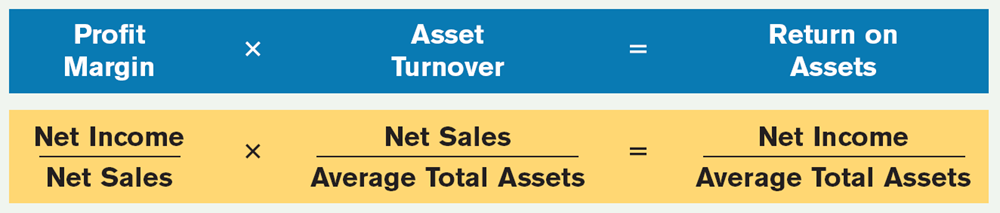
Return on Assets Ratio - Measures the overall profitability of assets in terms of the income earned on each dollar invested in assets.
Asset Turnover Ratio - Measures how efficiently a company uses its assets to generate sales.
Conclusion:
Financial statement analysis transforms raw data into actionable insight. Whether you're an investor, analyst, or CFO, these tools help answer key questions:
Is this company financially healthy?
Is it efficient?
Is it growing in the right ways?
And most importantly — is it worth betting on?
#FinancialAnalysis #Accounting #Finance